홈 / 책 찾기 / The Visual Display of Quantitative Infor…
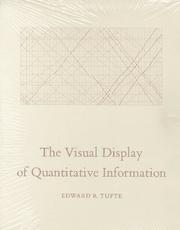
The Visual Display of Quantitative Information
The classic book on statistical graphics, charts, tables. Theory and practice in the design of data graphics, 250 illustrations of the best (and a few of the worst) statistical graphics, with detailed analysis of how to display data for precise, effective, quick analysis. Design of the high-resolution displays, small multiples. Editing and improving graphics. The data-ink ratio. Time-series, relational graphics, data maps, multivariate designs. Detection of graphical deception: design variation vs. data variation. Sources of deception. Aesthetics and data graphical displays. This is the second edition of The Visual Display of Quantitative Information. Recently published, this new edition provides excellent color reproductions of the many graphics of William Playfair, adds color to other images, and includes all the changes and corrections accumulated during 17 printings of the first edition.
| 제목 | The Visual Display of Quantitative Information |
|---|---|
| 저자 | Edward R. Tufte |
| 제본 | 양장(하드커버) |
| 언어 | 영어 |
| ISBN | 9780318029924 |
배송
결제가 확인되면 해외 판매처에 주문을 넣습니다. 받으시기까지 보통 2~3주 걸립니다. 국내에 들어오면 택배 송장번호를 주문 화면과 문자로 알려 드립니다.
통관
개인 주문은 개인통관고유부호가 필요합니다. 주문서에 넣어 주시고, 받은 번호는 그 주문에만 씁니다.
취소, 반품
해외 주문 전에는 주문 화면에서 바로 취소하실 수 있고 전액 환불됩니다. 해외 주문 뒤에는 단순 변심 취소가 어렵습니다. 받으신 책이 설명과 크게 다르거나 파손되었으면 다시 구해 드리거나 환불합니다.