홈 / 책 찾기 / Statistical Analysis and Data Display
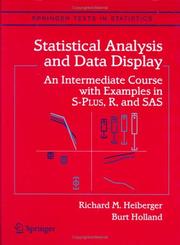
Statistical Analysis and Data Display
An Intermediate Course with Examples in S-Plus, R, and SAS
This contemporary presentation of statistical methods features extensive use of graphical displays for exploring data and for displaying the analysis. The authors demonstrate how to analyze data—showing code, graphics, and accompanying computer listings—for all the methods they cover. They emphasize how to construct and interpret graphs, discuss principles of graphical design, and show how accompanying traditional tabular results are used to confirm the visual impressions derived directly from the graphs. Many of the graphical formats are novel and appear here for the first time in print. All chapters have exercises. This book can serve as a standalone text for statistics majors at the master's level and for other quantitatively oriented disciplines at the doctoral level, and as a reference book for researchers.
In-depth discussions of regression analysis, analysis of variance, and design of experiments are followed by introductions to analysis of discrete bivariate data, nonparametrics, logistic regression, and ARIMA time series modeling. The authors illustrate classical concepts and techniques with a variety of case studies using both newer graphical tools and traditional tabular displays. The authors provide and discuss S-Plus, R, and SAS executable functions and macros for all new graphical display formats. All graphs and tabular output in the book were constructed using these programs. Complete transcripts for all examples and figures are provided for readers to use as models for their own analyses. Richard M. Heiberger and Burt Holland are both Professors in the Department of Statistics at Temple University and elected Fellows of the American Statistical Association. Richard M.
Heiberger participated in the design of the S-Plus linear model and analysis of variance commands while on research leave at Bell Labs in 1987–88 and has been closely involved as a beta tester and user of S-Plus. Burt Holland has made many research contributions to linear modeling and simultaneous statistical inference, and frequently serves as a consultant to medical investigators. Both teach the Temple University course sequence that inspired them to write this text.
| 제목 | Statistical Analysis and Data Display: An Intermediate Course with Examples in S-Plus, R, and SAS |
|---|---|
| 저자 | Richard M. Heiberger, Burt Holland |
| 출판사 | Springer New York |
| 출간 | 2010 |
| 쪽수 | 730쪽 |
| 언어 | 영어 |
| ISBN | 9781441923202 |
배송
결제가 확인되면 해외 판매처에 주문을 넣습니다. 받으시기까지 보통 2~3주 걸립니다. 국내에 들어오면 택배 송장번호를 주문 화면과 문자로 알려 드립니다.
통관
개인 주문은 개인통관고유부호가 필요합니다. 주문서에 넣어 주시고, 받은 번호는 그 주문에만 씁니다.
취소, 반품
해외 주문 전에는 주문 화면에서 바로 취소하실 수 있고 전액 환불됩니다. 해외 주문 뒤에는 단순 변심 취소가 어렵습니다. 받으신 책이 설명과 크게 다르거나 파손되었으면 다시 구해 드리거나 환불합니다.